Explore Now »
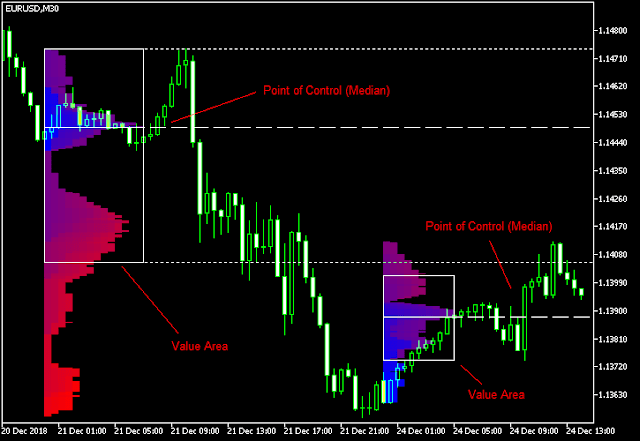
The Myfxpaddy Market Profile Indicator is a classic Market Profile implementation for MetaTrader, displaying price density over time, key price levels, the value area, and control value for trading sessions. It’s compatible with timeframes from M1 to D1 and works for daily, weekly, monthly, or intraday sessions. Lower timeframes offer higher precision, while higher timeframes provide better visibility. The indicator also supports a free-draw rectangle session for custom market profiles on any timeframe. It features six different color schemes and can display profiles as plain color histograms or based on bullish/bearish bars. The indicator is available for MetaTrader 4, MetaTrader 5, and cTrader platforms.
Key Features
• Session Flexibility: Choose between Daily, Weekly, Monthly, Intraday, or custom Rectangle sessions.
• Color Customization: Six color schemes available, with options for single color and bullish/bearish color schemes.
• Developing Profile Lines: Track the development of Point of Control, Value Area High, and Value Area Low through the session.
• High Performance: Optimized for minimal CPU load with adjustable redraw delays and histogram disabling.
• Alert System: Alerts for price crossing key levels like Value Area high/low, Median, and Single Print zones, with multiple notification options.
• Intraday Session Support: Define multiple intraday sessions with customizable start and end times.
Input Parameters
Main
• Session: Default is Daily. Options include Weekly, Monthly, Intraday, and Rectangle.
• StartFromDate: Set a custom start date if not starting from the current session.
• StartFromCurrentSession: Default is true, starts drawing from today.
• SessionsToCount: Default is 2, defines how many sessions to draw.
• SeamlessScrollingMode: Default is false, allows indefinite scrolling back in time.
• EnableDevelopingPOC/VAHVAL: Options to draw multiple lines depicting development.
• ValueAreaPercentage: Default is 70%, percentage share of TPOs in the Value Area.
Looks and Colors
• ColorScheme: Default is Blue to Red, with multiple options.
• SingleColor: Default is clrBlue for single color profiles.
• ColorBullBear: Default is false, colors profile blocks based on bar direction.
• MedianColor, ValueAreaSidesColor, ValueAreaHighLowColor: Customizable colors for key areas.
• LineStyles and Widths: Customizable styles and widths for median and value area lines.
• ShowValueAreaRays, ShowMedianRays: Project key levels to the right side of the chart.
• TimeShiftMinutes: Default is 0, adjusts session start time.
• ShowKeyValues: Default is true, displays key values on the left of the profile.
• SinglePrint settings: Customize single print profile and rays.
Performance
• PointMultiplier: Default is 0, adjusts profile’s price boxes for CPU optimization.
• ThrottleRedraw: Default is 0, delay before each redraw for CPU optimization.
• DisableHistogram: Default is false, makes indicator work extremely fast without histogram.
Alerts
• AlertNative, AlertEmail, AlertPush, AlertArrows: Multiple alert types for different conditions.
• AlertCheckBar: Default is Previous, controls the bar for checking alert conditions.
• AlertForValueArea, AlertForMedian, AlertForSinglePrint: Alerts for crossing key levels.
• AlertOnPriceBreak, AlertOnBarClose, AlertOnGapCross: Alerts for specific price movements.
• AlertArrowCode and Colors: Customizable arrow codes and colors for alerts.
Intraday Sessions
• EnableIntradaySessionN: Default is true, for drawing intraday market profiles.
• IntradaySessionNStartTime/EndTime: Customizable start and end times.
• IntradaySessionNColorScheme: Default is Blue_to_Red, for intraday sessions.
Miscellaneous
• SaturdaySunday: Options for handling Saturday and Sunday sessions.
• DisableAlertsOnWrongTimeframes: Default is false, controls alerts on incorrect timeframes.
• ProminentMedianPercentage: Default is 101, percentage of TPOs for prominent median.
Examples
• Daily Sessions: Displaying market profiles for two daily sessions.
• Bullish/Bearish Coloring: Profiles colored according to bar direction.
• Rectangle Sessions: Custom market profiles based on freely drawn rectangles.
• Right-to-Left Display: Histogram drawn from right to left for current session focus.
• cTrader Version: Available for cTrader with similar features but limited alert types.
How to Use Market Profile in Forex Trading?
Market Profile is a tool developed by a CBOT trader to organize price and time information during a trading session. Despite differences in the modern Forex market, it remains useful with adaptations like rolling 24-hour windows or geographically-bound time windows for session calculation.
Original build credits to: earnforex, indicator revamped and improved by myfxxpaddy.


.jpeg)
.jpeg)


